

How To Create A Combined Field In Tableau

Introduction to Concatenate in Tableau
The concept of Concatenation essentially refers to the fact that multiple fields can be combined together in order to serve a particular context-based purpose. Often strings are combined in order to form another string that will convey some meaning. The use of concatenation in Tableau may be considered different than that of any programming language. In Tableau, concatenate is generally applied in cases when two or more fields are to be combined to form another field. This combined field will have some meaning in itself.
Syntax:
The concatenation in Tableau can be done using the '+' operator. The syntax for concatenation in Tableau is as follows.
string_1 + string_2 + string_3…+ string_n
The concatenated field created using the above syntax will be a calculated field in Tableau.
How to use Concatenate in Tableau?
For this demonstration, we are going to use the Distribution Unit Volume dataset which contains volume distributed across various cities in India. The hierarchy of distribution area is Regions -> Distribution Unit -> City. Important dimensions are the Distribution Unit and Region, while the Distribution Volume is a measure. We'll demonstrate the concept of concatenate and its application using this dataset as described in the following section.
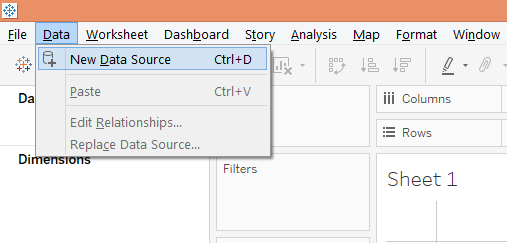
1. First load the dataset. For that click on "New Data Source" under Data Menu as shown below.
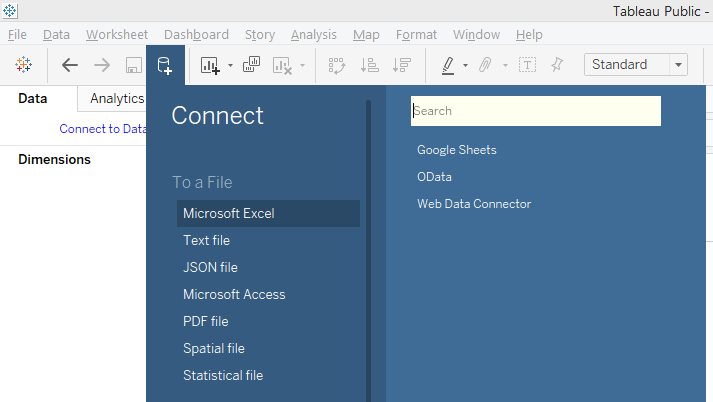
2. In the Connect section select the requisite data source type. In this case, it is clicked on "MS Excel", so click on "Microsoft Excel" as shown below.
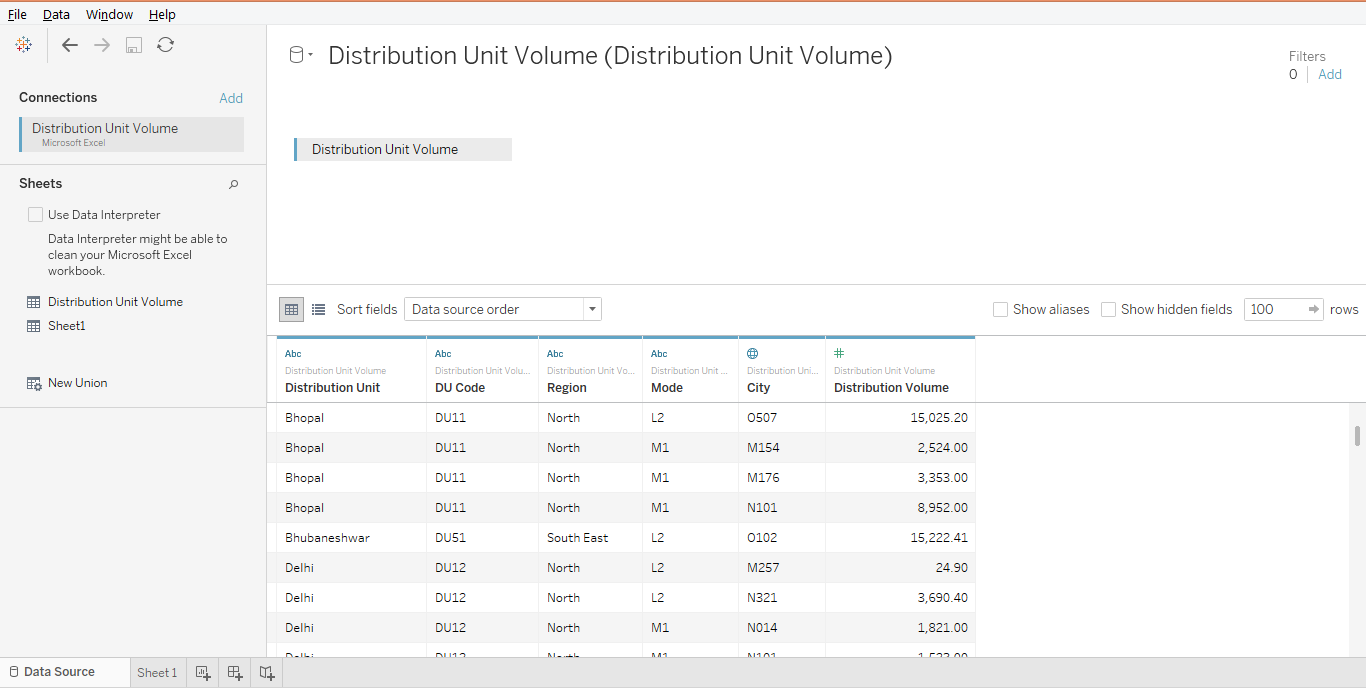
3. The data gets loaded and can be seen in the Data Source tab as shown below.
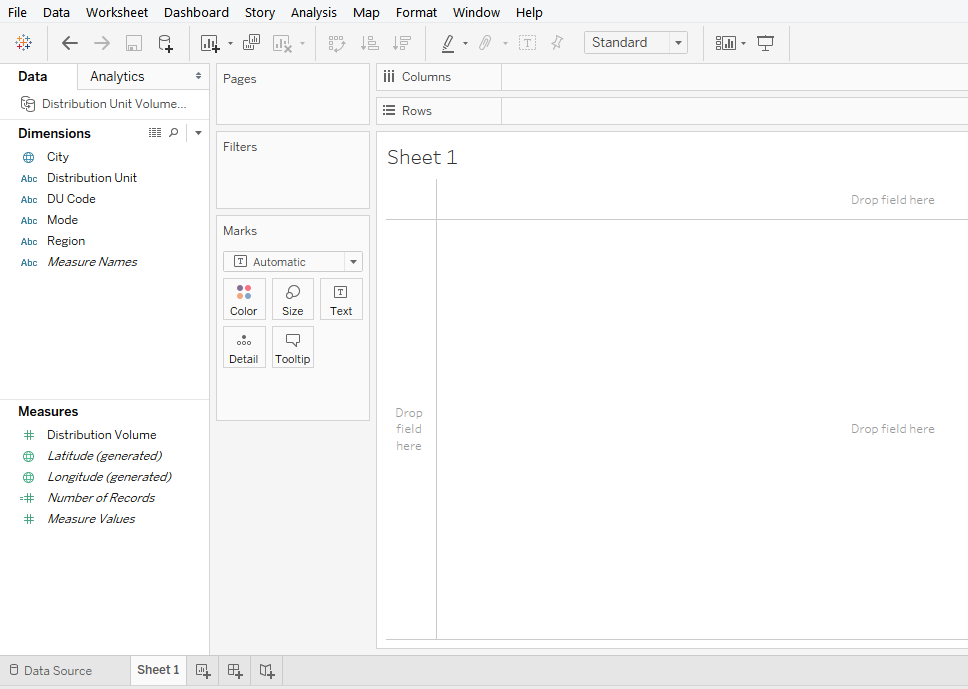
4. Moving to the sheet tab, we can see the dimensions and measures present in the requisite sections as can be seen in the following screenshot.
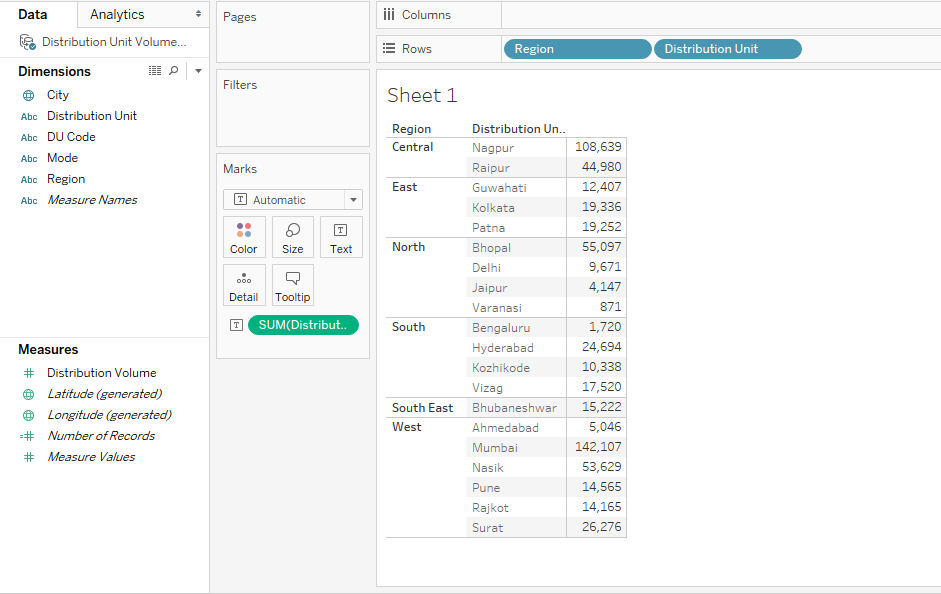
5. To begin with, bring Region and Distribution Unit dimensions into Rows region and drag Distribution Volume measure over Text in Marks card. As a result of this action, we get a table giving Distribution Unit wise Distribution Volume for different regions. This is as shown in the following screenshot.
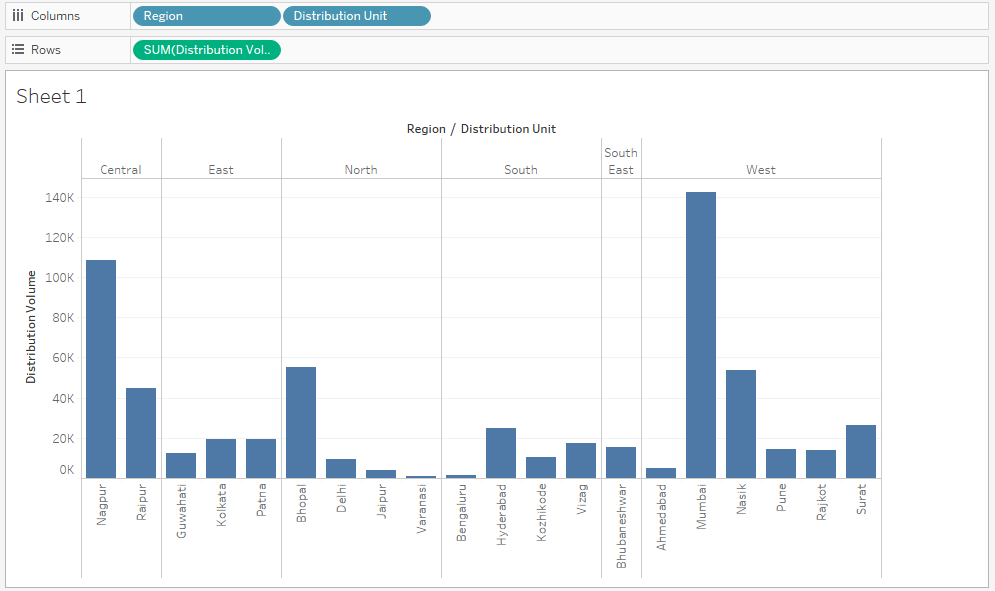
6. We created a column chart over the above table, which is as shown below. If we go through it, we can find that a regional breakup is making the appearance messy. What if we bring another dimension into the analysis? The analysis shall then become too complex to derive any insights.
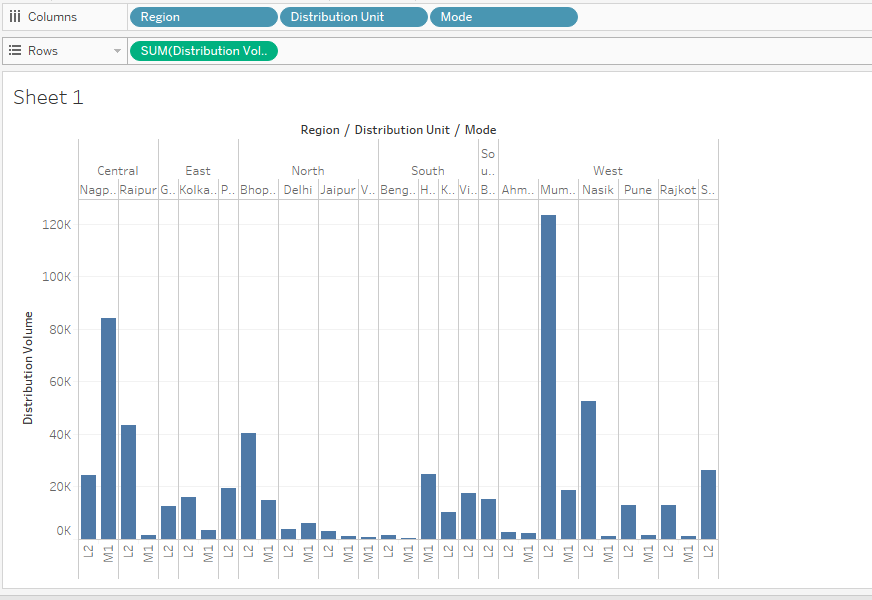
7. As mentioned above, we brought another dimension i.e. Mode into the analysis, as shown below. Now, we can find that the analysis has become complicated. Our intention is to visualize the Distribution Unit wise Distribution Volume for different regions for each of the modes. However, it seems, using this approach we may not be able to derive any insights properly.
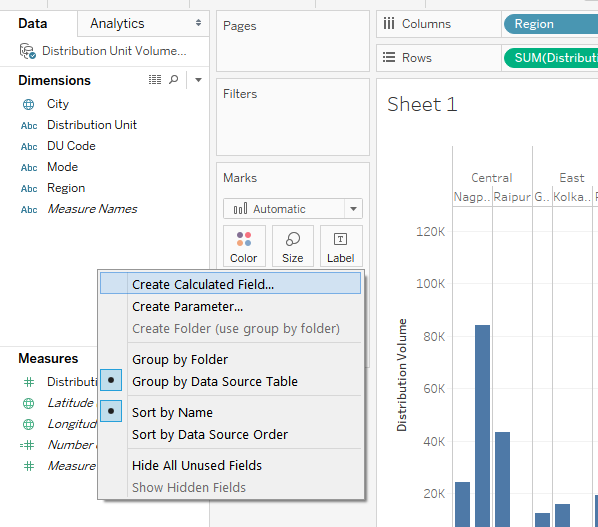
8. Now, in order to overcome the issue of complexity, we can use the concatenation functionality provided by Tableau. Using this functionality, we will combine three dimensions or fields viz. Distribution Unit, Region and Mode in this order. The combined field will act as a unique field and work as a single field. Working with and deriving insight through this single field is a lot easier than using multiple fields together. We can create a combined field through the "Create Calculated Field" option. Click anywhere in the blank space in the Data tab, and click on "Create Calculated Field" as illustrated in the following screenshot.
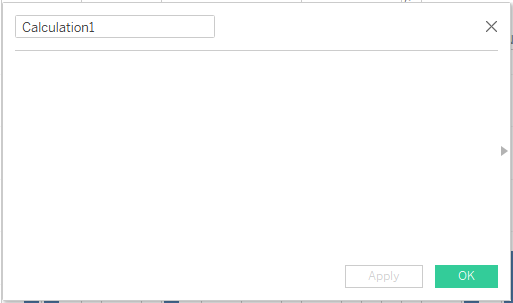
9. When we follow the above step, the calculated field pane pops-up as shown below. The default name for the field is "Calculation1".
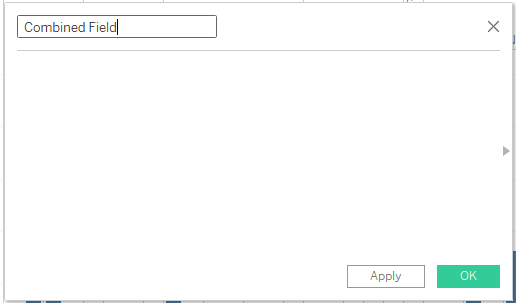
10. Rename the field as "Combined Field" as shown below. An appropriate name should be provided to the field that should convey meaning. When done, click on Apply and then on OK.
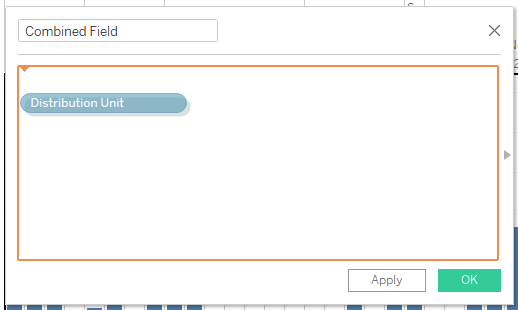
11. Now, the next step is to bring the dimensions one-by-one. We will create the field of the type [Distribution Unit]_[Region]_[Mode]. E.g. if the Distribution Unit in Ahmedabad, its region i.e. West, and the Mode is L2, then the Combined Field value would be Ahmedabad_West_L2. In this way, all the field values should get generated. The following screenshot shows the Distribution Unit dimension being dragged into the calculated field.
12. Once the first dimension (Distribution Unit in this case) is brought then the next in the syntax is the '+' operator. The string to be inserted between has to be specified in double-quotes. This is very important, otherwise, the field won't get created and we shall get an error.
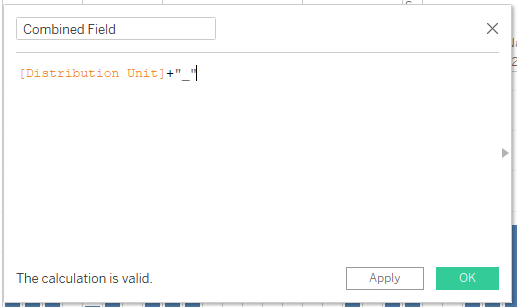
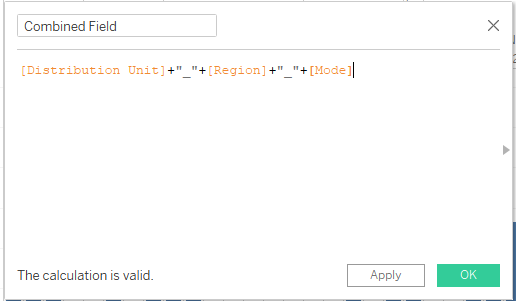
13. Likewise, bring the rest two dimensions viz. Region and Mode into the calculated field, and using the syntax properly, create the field as shown in the following screenshot. Remember, if the syntax is implemented properly, then we get the "The calculation is valid" message in the right-hand bottom corner of the field. Observe carefully, each and every element in the following screenshot, and check how the syntax works.
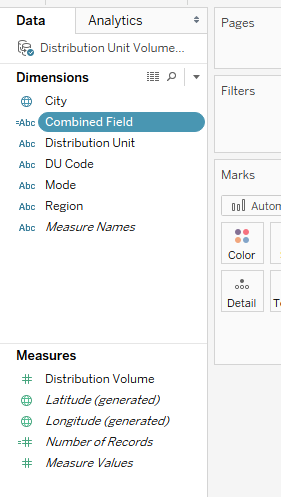
14. The newly created field "Combined Field" can be seen in the left-hand side of the window, in the Dimensions section. This is as shown in the following screenshot.
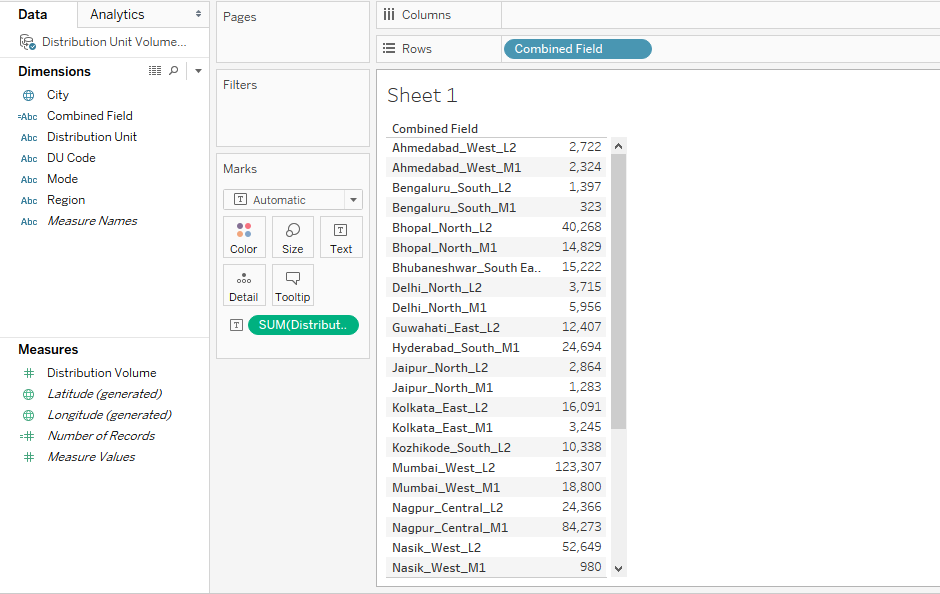
15. Just double click on the newly created calculated field "Combined Field" and it is brought into the Rows region. Next, drag Distribution Volume measure over Text in the Marks card. As we can see, in the following screenshot, we got the Distribution Volume value for each of the Combined Field values. The newly created field gives better insight into the data.
16. We will create a column chart over the above table, and observe carefully the analysis in the following screenshot. The analysis offers more clarity than the one we have created in the preceding section, which takes the Distribution Unit, Region and Mode as different dimensions.
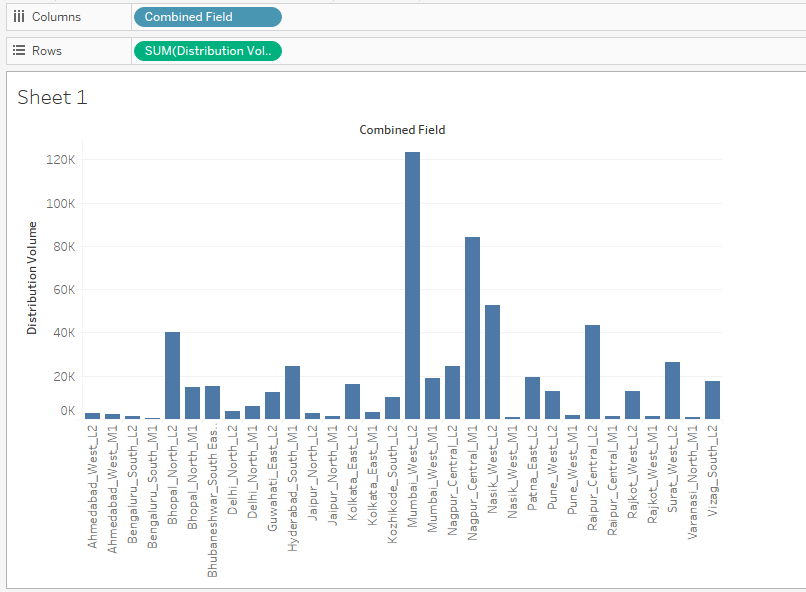
17. Some of the dimension values in the above screenshot are not visible properly, so we just modified the above chart in the horizontal bar chart which is shown below. Now, the name appears properly.
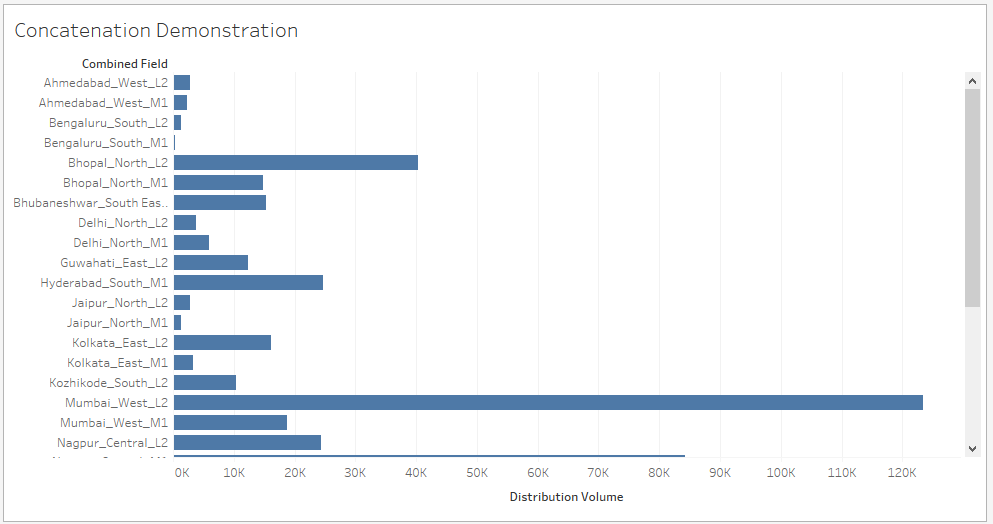
The above visualization is an example of how we can employ the concatenate function in Tableau effectively to make the insight derivation process easy and efficient.
Conclusion
Tableau is a visual analytics tool that lays heavy impetus on employing visualizations to facilitate insight derivation. Though not being a programming tool, it does provide functionalities such as concatenation. The functionality of concatenation in Tableau is useful in various contexts, especially when combining multiple fields.
Recommended Articles
This is a guide to the Concatenate in Tableau. Here we discuss how we can employ the concatenate function in Tableau effectively to make the insight derivation process easy and efficient. You may also have a look at the following articles to learn more –
- String Functions of Tableau
- Map Layers in Tableau
- Dashboard in Tableau
- Tableau New Features
- Different Concepts of Tableau Action Filter
How To Create A Combined Field In Tableau
Source: https://www.educba.com/concatenate-in-tableau/
Posted by: linseymarban.blogspot.com
0 Response to "How To Create A Combined Field In Tableau"
Post a Comment